


.jpg?width=300&auto=webp&quality=80&disable=upscale "Businesswoman standing in data center.")


.jpg?width=150&auto=webp&quality=80&disable=upscale)

Treasures from the Archives...
Barak Turovsky Analyzes AI’s Natural Language Processing Revolution
Cisco VP of AI Barak Turovsky explores the potential for natural language prompts to further enable automation adoption.
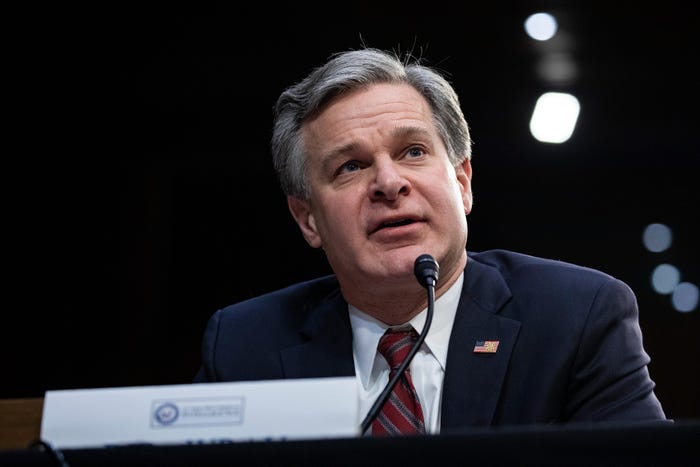
FBI Director Christopher Wray called for collaboration to protect critical infrastructure from Chinese government cyber threats.
Latest Commentary
Chief Technology Officer, Benevity
Vice President and Chief Information Security Officer, United Airlines
Head of Developer Relations and Community, Sonar
Senior Director, Capgemini Invent North America
Cisco VP of AI Barak Turovsky explores the potential for natural language prompts to further enable automation adoption.